Galileo Galilei (1564 – 1642) the Italian astronomer and physicist was correct when he said, “The book of nature is written in the language of mathematics.” He believed that the universe is governed by mathematical principles and that understanding these principles is essential for understanding the world. He emphasized the importance of measurement, experimentation, and quantification in scientific inquiry. He knew that by using mathematical tools and concepts more extensively, we can uncover new insights, make data-driven decisions, and drive meaningful action. Galileo’s legacy would urge us to leverage mathematics to its full potential to quantify the impact of our actions and illuminate the path forward in the fight against climate change.
Time may have passed, but his ideas remain relevant today. If Galileo was alive in 2009, he would have loved the display of the “CO2 Cube” that was exhibited at the COP-15 Summit in Copenhagen to send a message to approximately 50,000 world leaders. It was called the CO2 Cube: Visualizing A Metric Tonne of Carbon. This cube wasfeatured on the cover of the daily Copenhagen Conference newspaper on the opening day and was covered in over 200 news stories. The goal was to help people understand the scale of carbon dioxide emissions and inspire sustainablesolutions. It was a notable example of the UN using visual aids to raise awareness about climate change and to help people understand the scale of greenhouse gas emissions.
Galileo would have been happy with this because this effort by the UN had:
- Visual impact: Seeing a physical representation of a large quantity of CO2 made the abstract concept more tangible and memorable.
- Educational Value: It helped people grasp the magnitude of emissions and their impact on the environment.
- It was a communication tool: This presentation, exhibition, or public outreach effort conveyed the importance of reducing emissions.
It was effective because:
- It accurately represented the scale, volume, mass and weight of CO2.
- It provided context by offering a comparison or explanation to help people understand the significance of one tonne of CO2.
- It engaged the audience by using the model as a starting point for discussions and workshops to encourage people to think about their own carbon footprint.
- It showed that overall, a well-designed scale model can be a powerful tool for raising awareness about climate change and promoting sustainability.
The cost to build and install this visual aid was estimated at approximately $250,000 US funds, but considering the ability it had to send an important message at the conference it was considered worth it. The 8.2 metre Cube was made to be a giant multimedia arts installation. It was made of a stack of shipping containers, and it had movies projected onto it as it floated on St. Jorgens Lake near the Tycho Planetarium. It was a collaboration between the United Nations and the arts world. It was 8.2m x 8.2m x 8.2m (27 x 27 x 27 feet). Regrettably the CUBE did not travel around the world to help send its message after theconference was over. Galileo would have been saddened by this for several reasons:
- Not sending the display on a world tour was a missed opportunity for global awareness: The CUBE’s messageabout climate change and carbon emissions could have resonated with people worldwide, inspiring action and awareness.
- By not travelling, the CUBE’s influence was confined to a single conference, rather than reaching a broader audience.
- Galileo’s emphasis on sharing knowledge: As a pioneer of scientific inquiry, Galileo valued the dissemination of knowledge and ideas. He might have seen the CUBE’s limited reach as a missed chance to educate and engage people globally.
- The power of experiential learning: Galileo believed in the importance of observation and experience. TheCUBE’s travels could have provided a tangible, immersive experience for people to grasp the significance of climate change.
- By not traveling, the CUBE did not have fulfilled its potential as a catalyst for global conversation and action on climate change.
But if Galileo were here today, we could show him that time has not forgotten his wisdom. He said, “Measure what canbe measured, and make measurable what cannot be measured.” and to fight climate change more effectively, we can do more of that. One innovative way to apply Galileo’s wisdom to the climate crisis is through the Litreprint, a metric that quantifies greenhouse gas emissions in a tangible and relatable way.
Every litre of fuel we burn produces 2.345 kilograms of carbon dioxide, which is a mass of invisible greenhouse gasequivalent to the volume of a 109-centimetre cube that will linger in the atmosphere for hundreds of years, accumulating and contributing to the growing threat of climate change.
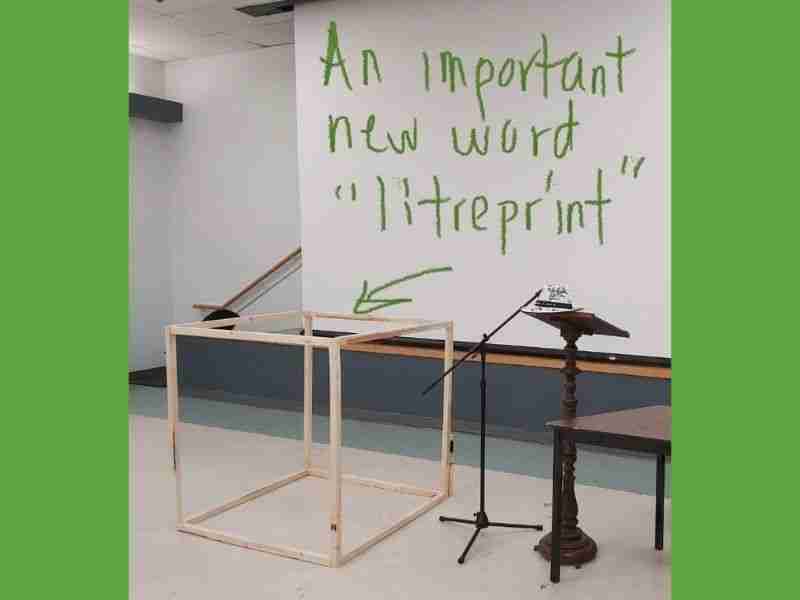
Let’s call this 109cm cube of CO2 a “Litreprint” – a fresh and powerful visual tool that brings the impact of our carbon footprint to life. It can help us put the reality of climate change into perspective, one litre of fuel at a time. It represents the size of the consistent mass of CO2 emissions produced by the burning of every litre of fuel, making it a reliablemetric for comparison and discussion everywhere on the planet.
It’s not too big like a metric tonne of CO2, which is equivalent in size to an 8.23-metre cube, and not too small likegrams of CO2 per kilometre driven, as shown on all new vehicle labels. It offers a more nuanced understanding of carbon emissions, breaking down the abstract concept of one tonne into smaller more relatable units.
To put this into perspective, the average Canadian vehicle burns about nine litres of fuel every 100km. This means it produces about nine Litreprints every 100 km. This would stretch the 109cm cube of CO2, like a ruler for measurement, to be approximately 9.8 metres long, highlighting the significant impact of our daily driving habits on the environment.
But the visualization of the impact should not stop there.
Many long-haul transport trucks produce approximately 40 Litreprints every 100 km. Let’s consider a shipment of10,000 bottles of wine travelling 4,000 km by truck. Over this distance, the truck can burn enough fuel to produce 1,600 Litreprints.
Since 426 Litreprint CUBEs will fit into a one tonne of CUBE CO2, this means the fuel burned for the shipment would produce 3.75 tonnes of greenhouse gas. In this case, each bottle’s contribution to the total CO2 emissions of the shipment would be equivalent to roughly the size of 140 times its own volume. This means a wedding reception thatconsumes 100 bottles of this wine would produce a mass of CO2 the size of about 1,400 bottles of wine.
This shocking example illustrates the hidden environmental cost embedded in products that travel long distances. This is also known as supply chain emissions that often represent 70 to 90 per cent or more of a company’s total emissions. Bybuying locally produced wine, we would save this large amount of CO2 and reduce our environmental footprint.
I suspect Galileo would smile at this and say it is a good example of “making measurable whatever cannot, (normally) be measured. The same situation applies whenever we buy strawberries from California, or Mexico, when locallygrown strawberries are available to us, or when we buy an office chair from China when we can buy a similar chair made closer to home.
The observation is the cumulative effect of the Litreprints we produce is staggering and focusing on them can highlight the importance of buying local and reducing our reliance on products that travel long distances.
The Litreprint offers a new way to understand and visualize greenhouse gas emissions, making it easier to grasp the impact of our daily choices. They are the reason so much emphasis is put on the fuel efficiency of all small, medium and large size vehicles and is also the reason we should not idle needlessly. They are also why we need to promote and embrace electric vehicles.
I hope it will travel far and wide contributing to a clearer understanding of our impact on the planet.
If we think about them and visualize them as 109-cm cubes of CO2, we can see the size of the invisible CO2 gas weproduce every day. This visualization can help us focus more on our choices, our consumption habits and our transportation options to help the world mitigate climate change.
We can take more control of our carbon footprint if we use the Litreprint as the music of reason, the melody of logic and the beat that keeps us in sync with sustainable practices. Let’s use it to drive meaningful change and build a better future for the planet.
*****